
Record $5,000 Bitcoin Price Triggers $13 Billion Market Sell-Off
The bitcoin price touched $5,000 this morning, ushering in a historic moment for the cryptocurrency ecosystem. Unfortunately, this achievement also triggered off a comprehensive market sell-off. Almost every major cryptocurrency–including ethereum, Ripple, and IOTA–experienced significant price decreases.

Chart from CoinMarketCap
The sell-off led to a significant crypto market cap pullback. At the height of the rally, the total value of all cryptocurrencies reached $179.7 billion–a new all-time high. However, nearly $13 billion of that has evaporated in the past 12 hours, bringing the current market cap to about $167 billion.
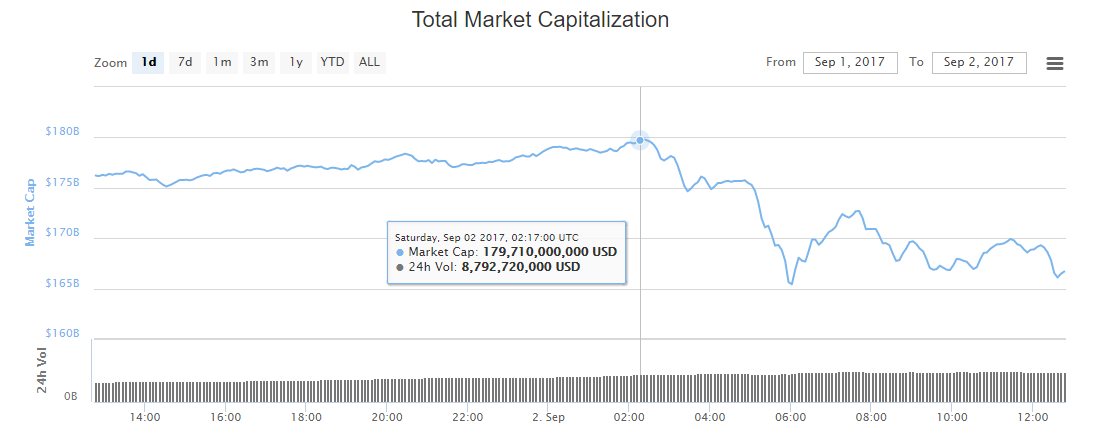
Chart from CoinMarketCap
Bitcoin Price Hits $5,000, then Dives
The bitcoin price crossed the $5,000 threshold on several exchanges during the early morning hours of September 2, raising the global average price to an all-time high of $4,975. Unfortunately, the bitcoin price did not sustain that level for long. By 3:30 UTC, the bitcoin price had fallen to $4,800. Within another three hours, it had plunged to $4,625. Bitcoin rallied back to $4,775, but the upward momentum did not continue. By the time of writing, the bitcoin price had dropped to $4,630, which translates to a $76.6 billion market cap.
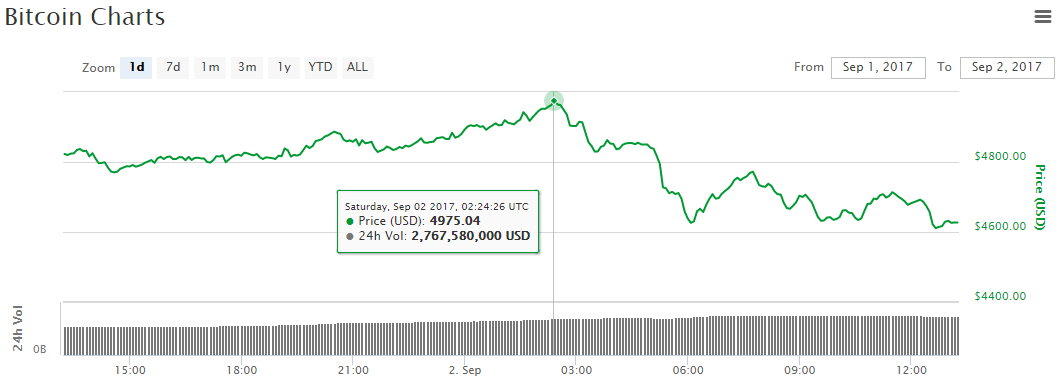
Bitcoin Price Chart from CoinMarketCap
Ethereum Price Rally Stalls
The bitcoin sell-off led to a widespread market pullback, and the ethereum price was not immune. For most of September 1, the ethereum price hovered at about $390. But once bitcoin began to fall, ethereum followed. The ethereum price plunged as low as $352 at 6:00 UTC and currently sits at $357. This reduced ethereum’s market cap to $33.7 billion–a 24-hour decline of 8%.
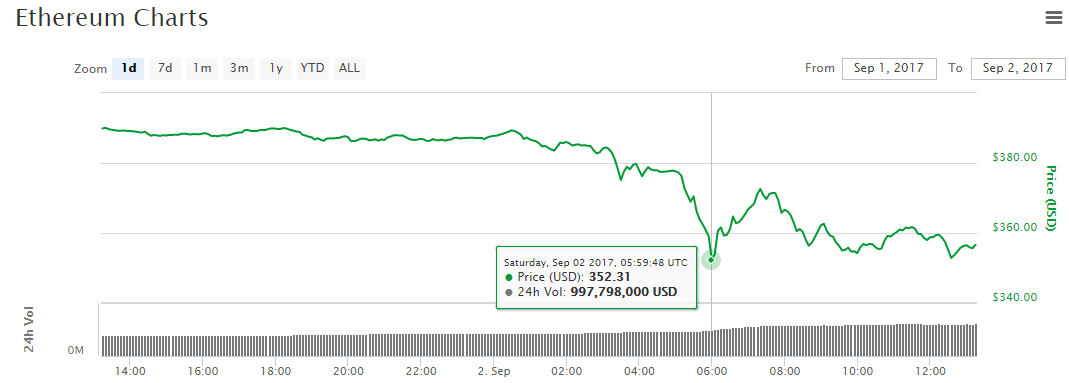
Ethereum Price Chart from CoinMarketCap
Litecoin Price Reaches $92 for New ATH
The altcoin markets turned red following the bitcoin sell-off, and only three top 25 cryptocurrencies made positive movement for the day.
After inching back to $600 yesterday, the bitcoin cash price dropped to $591. The Ripple price mirrored ethereum’s plight, dropping 8% to $0.231.
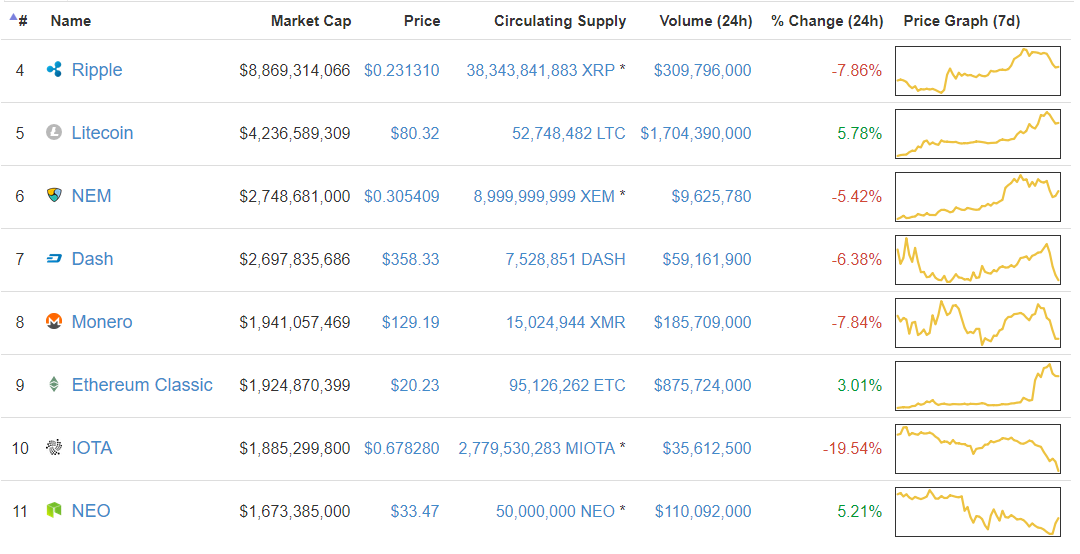
Altcoin Price Chart from CoinMarketCap
Litecoin was one of the rare coins with a 24-hour price increase. The litecoin price increased 6% to $80. During the past day, only bitcoin boasted a trading volume greater than litecoin’s $1.7 billion.
However, what this statistic conceals is the fact that the litecoin price had actually risen to a new all-time high of $92 this morning, meaning that it has dropped $12 from its daily peak. Litecoin now has a market cap greater than $4.2 billion.
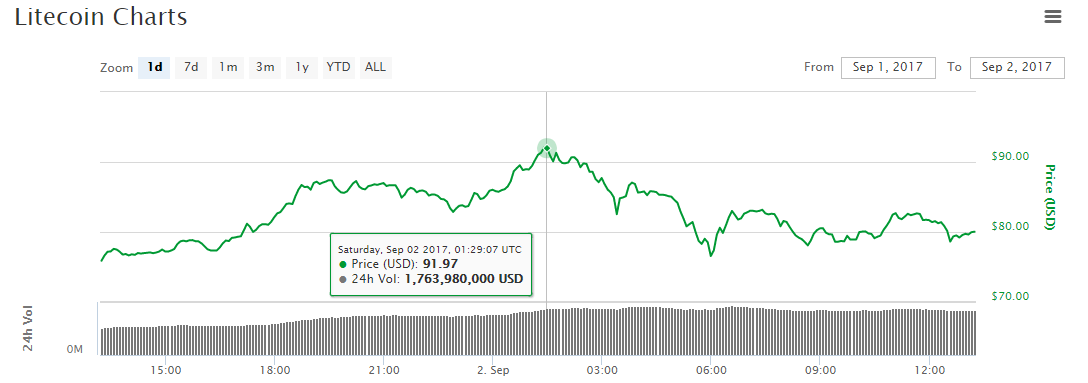
Litecoin Price Chart from CoinMarketCap
The NEM price fell 5% but maintained a slight market cap edge on Dash, which returned a 6% decline. The Monero price, meanwhile, fell 8%, forcing its market cap below $2 billion. Tenth-ranked IOTA had the worst performance of any top 10 coin, plunging 20% to $0.678.
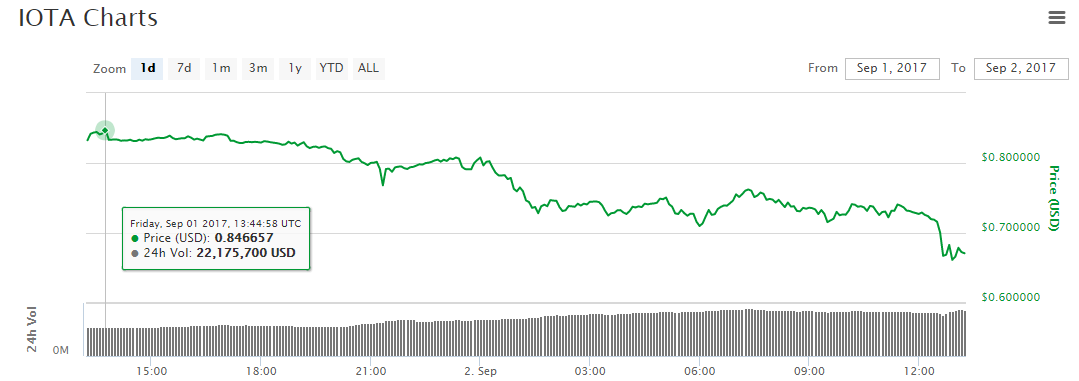
IOTA Price Chart from CoinMarketCap
Aside from litecoin, only two top 25 cryptocurrencies increased in value over the past 24 hours. Ethereum classic, now ranked 9th, grew 3% to $20 as part of its latter-week rally. NEO, which recently dropped out of the top 10 following a steep decline, managed to defy the wider markets and rise 5% to $33.
Bitcoin Dominance Stable for Week
Bitcoin’s slice of the total crypto market cap ended the week at 45.8%, which is just slightly below where it began. Ethereum’s share had swelled during the middle of the week but had tapered to 20.1% by Saturday. Litecoin recorded the week’s most significant gains, rising from 1.7% on August 26 to 2.5% on September 2.
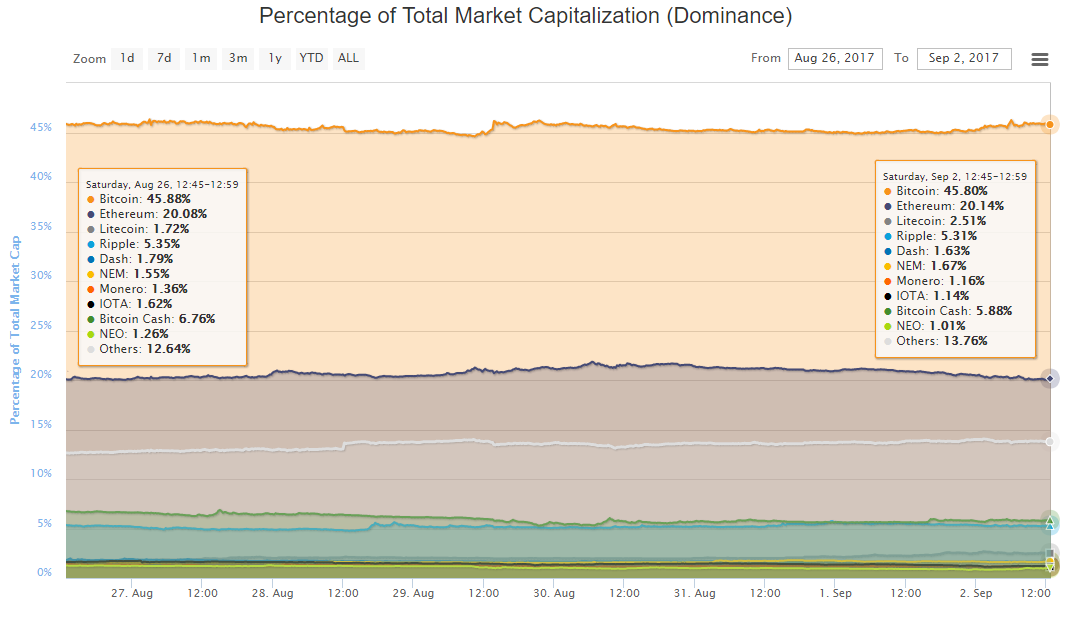
Market Cap Distribution Chart from CoinMarketCap
As the distribution currently stands, bitcoin cash and Ripple account for 5.9% and 5.3%, respectively. The remaining ~20% is divided between the other 1,000 or so coins and assets tracked by CoinMarketCap
Author: Josiah Wilmoth on 02/09/2017
Posted by David Ogden Entrepreneur
David O