
Bitcoin, Ethereum, Bitcoin Cash, Ripple, IOTA, Litecoin, NEM, Cardano – Price Analysis, Jan. 23
When the markets are bullish, a lot of traders only focus on high target levels. This leads to a left out feeling among the ones who have missed out on the rally, and they rush to buy at elevated levels. This results in a huge loss of capital to the uninformed traders.
The opposite works when the market falls. One starts to hear bearish voices with the analysts forecasting apocalypse and novice traders get scared and dump their holdings. They buy when they should be selling and sell when they should be buying.
Hence, it is always better to take these forecasts with a pinch of salt. We, therefore, avoid giving unrealistic target levels to our readers and try to keep them on the right side of the trade.
BTC/USD
In our previous analysis, we had predicted that Bitcoin would turn down from the $13,202 levels and that is what happened. The cryptocurrency topped out at $12,988.89 on Jan. 20. It is currently retesting the critical support zone of $10,704.99 to $9,300.
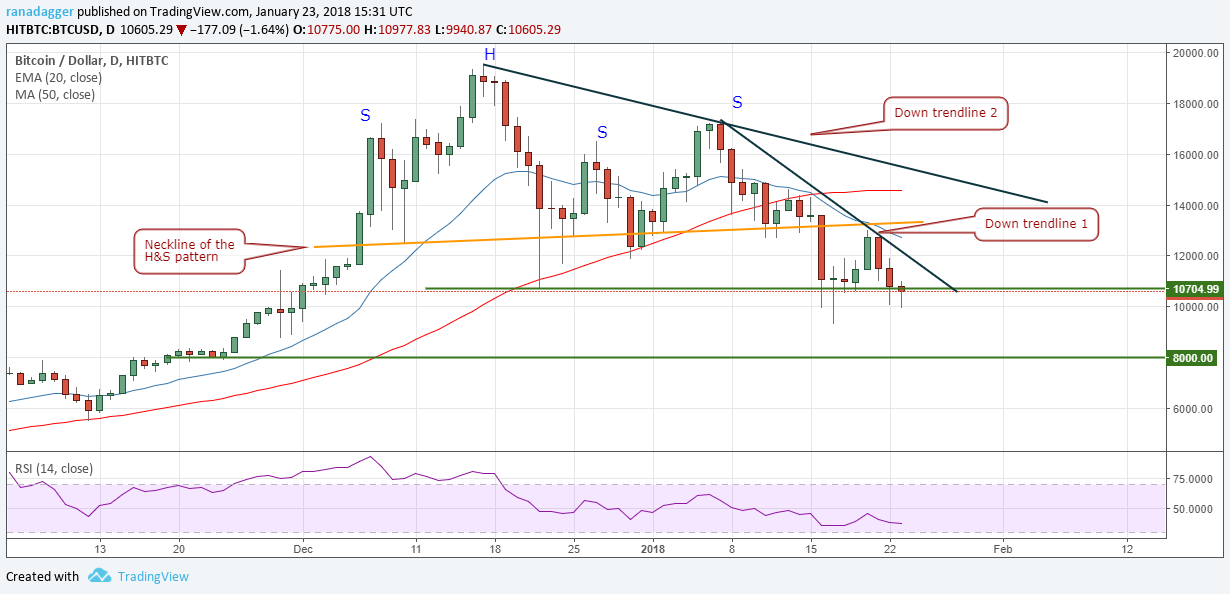
For the past two days, the bulls are defending the $10,000 levels. If this level holds, we may see another attempt to pull back. The trend will turn positive in the short-term only when the BTC/USD pair breaks out of the down trendline 1.
This trade should be taken with only 50 percent allocation because on the way up, Bitcoin will face resistance at the neckline of the head and shoulders pattern and at the down trendline 2.
On the downside, a break of $10,000 is likely to hurt sentiment, resulting in a decline to $8,000 levels.
ETH/USD
We had forecast a rally to $1174.36, which is the 61.8 percent Fibonacci retracement level of the recent fall from $1424 to $770 and Ethereum topped out at $1,160 on Jan 20.
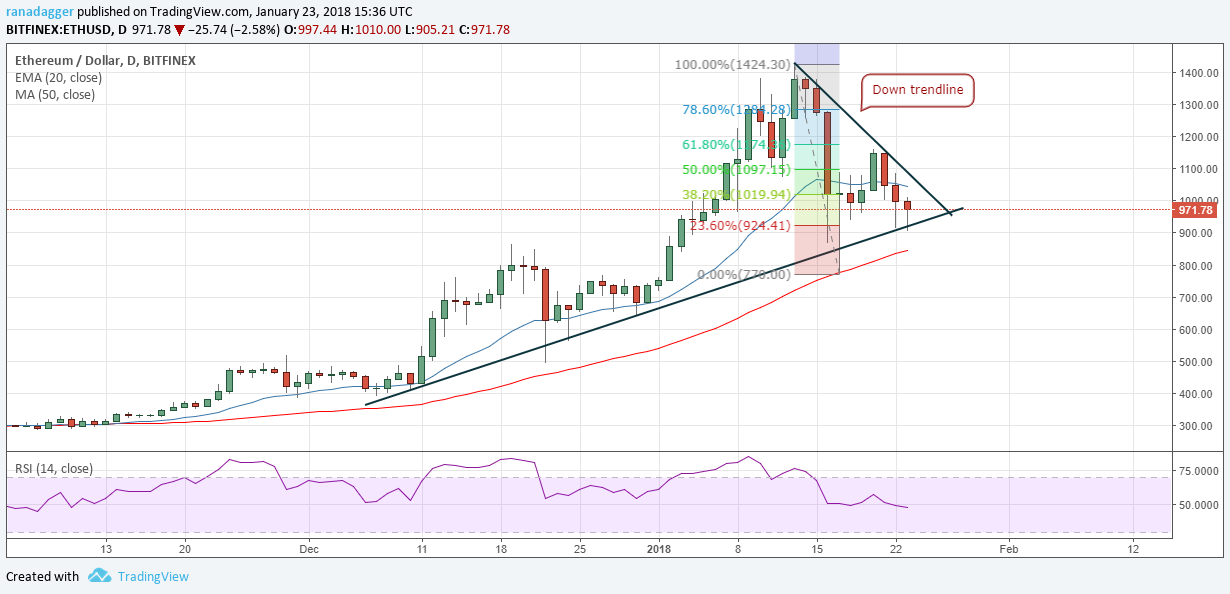
The price has returned to the trendline support, which has offered strong support since Dec. 10.
The bulls have been attempting to hold the trendline support for the past two days. We believe the support zone between $900 and $845 is likely to be defended strongly by the bulls. The ETH/USD pair will indicate a change in trend only after it breaks out of the down trendline.
If the above-mentioned support zone breaks, the decline can extend to $770 levels. We don’t find any buy setups; hence, we are not suggesting any trade on it.
BCH/USD
In our previous analysis, we had anticipated Bitcoin Cash to return from the $2,072 levels, and it topped out at $2,112.11 on Jan. 20.
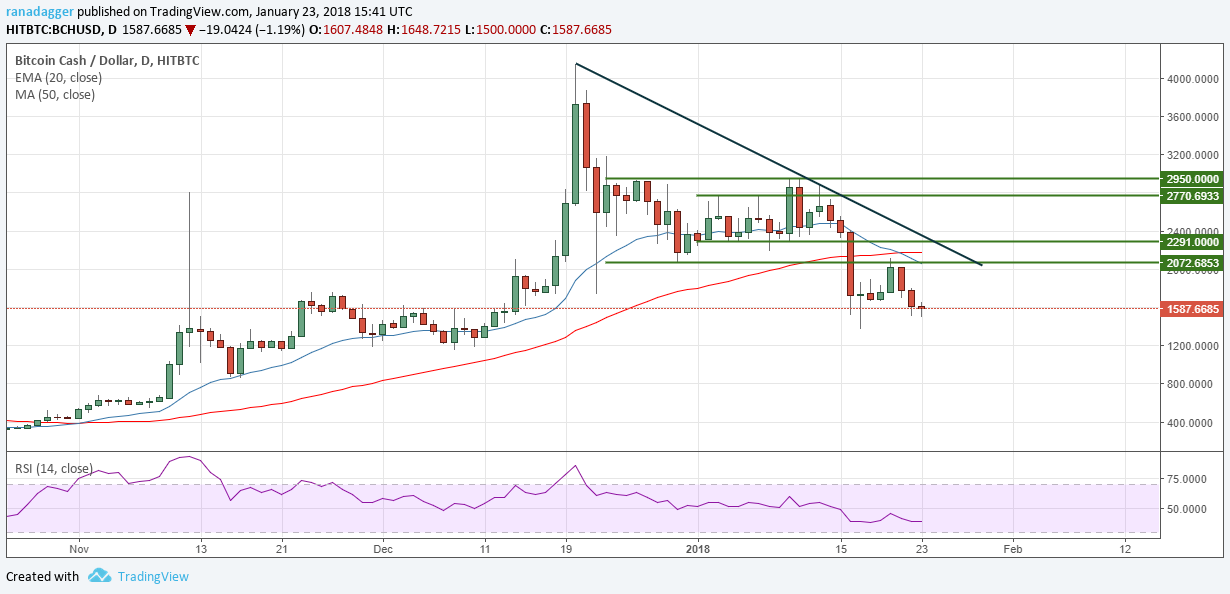
The moving average has completed a bearish crossover, and the price is quoting below the 20-day EMA and the 50-day SMA; which is advantageous to bears. If the retest of the recent lows at $1364.96 fails, a fall to $1194 is likely.
If the bulls defend the $1364.96 levels, the BCH/USD pair is likely to become range-bound for a few days.
As the trend is still down, we are not suggesting any trade on it.
XRP/USD
Ripple returned from the 20-day EMA on Jan. 18. It currently has support at the $0.87 levels.
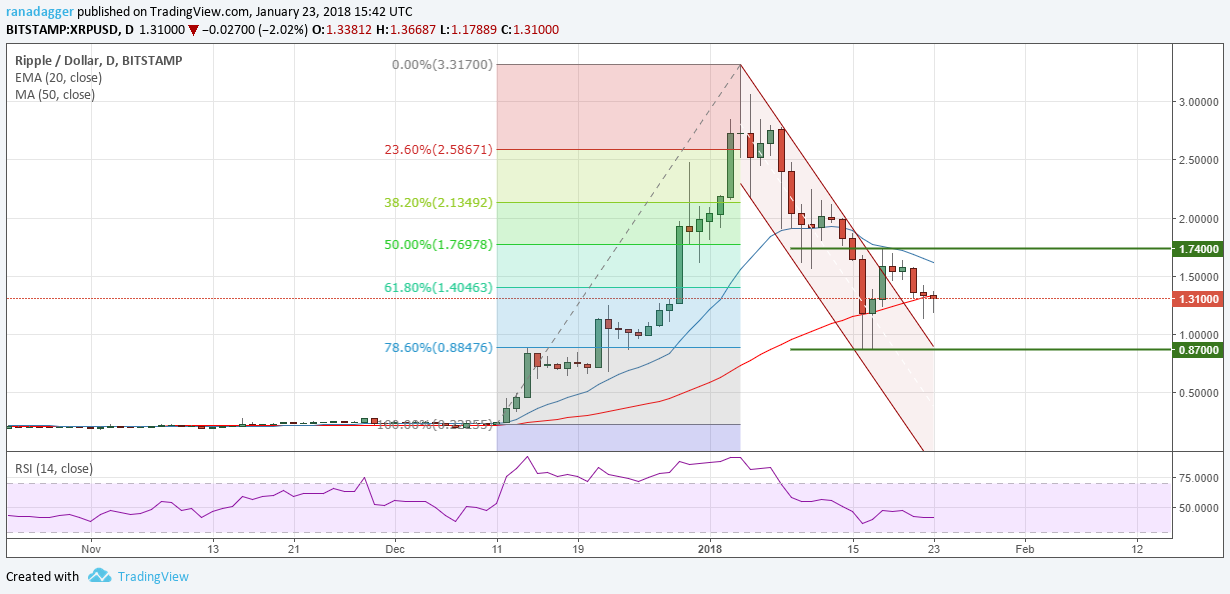
We believe that the XRP/USD pair will become range bound for the next few days between the support of $0.87 and the resistance of $1.74.
We shall wait for a breakout above the overhead resistance to initiate any long positions. On the downside, though we expect the $0.87 to hold, it might be reasonable to wait for a bounce before buying. As the trading inside the range is likely to be volatile, we shall only try to buy closer to the supports.
IOTA/USD
We had mentioned that $3.032 is the critical level for IOTA and a failure to break out above it will attract another bout of selling and that is what happened.
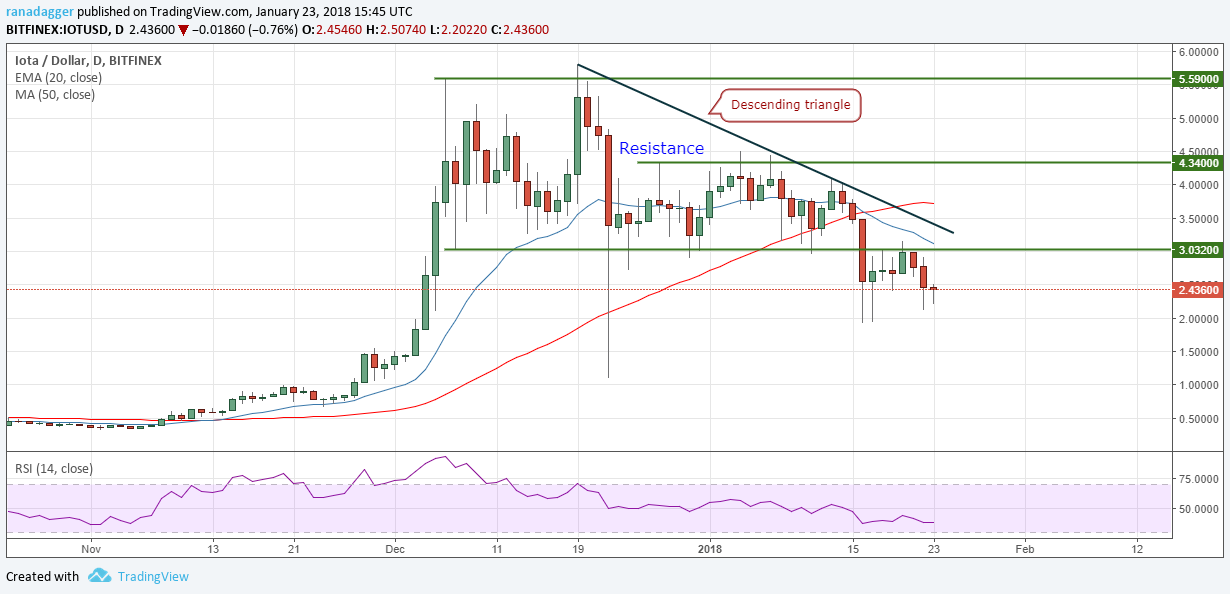
The cryptocurrency is currently attempting to hold the Jan. 16 low of $1.923. If the bears succeed in breaking down this support, a fall to the lows of Dec. 22 of $1.10 is likely.
If the bulls hold the $1.923 levels, the IOTA/USD pair is likely to remain range bound for the next few days. It will become positive only if the price breaks out of the down trendline of the descending triangle.
LTC/USD
Litecoin broke above $205, but could not reach $225, as we had expected. It turned down from $214.48 levels on Jan. 20.
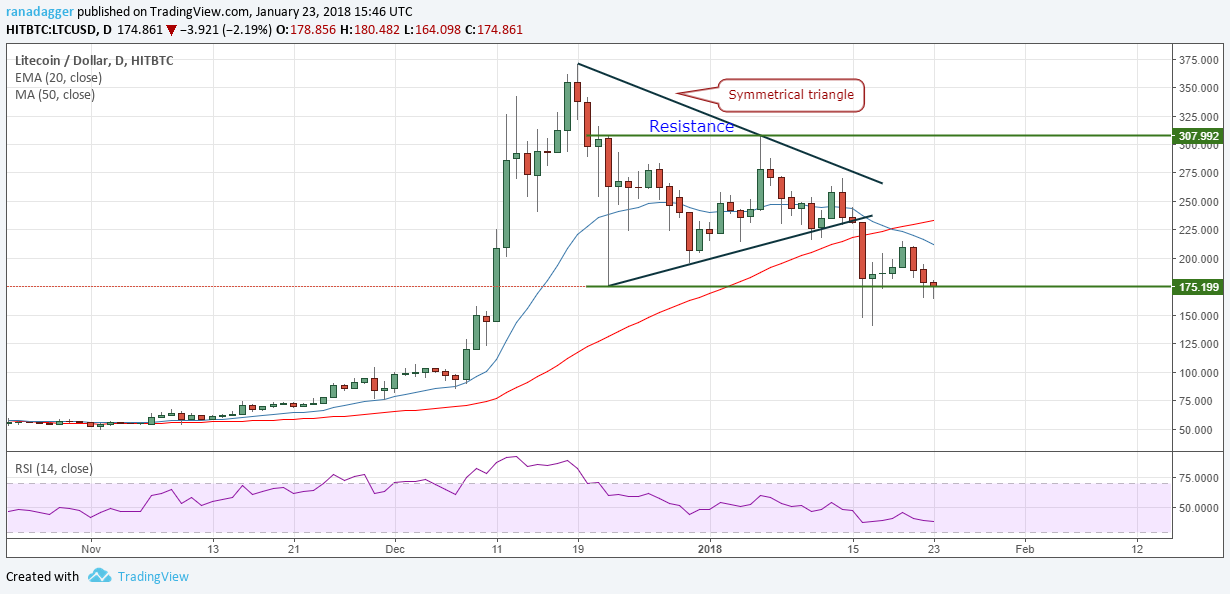
The bears are trying to break down of the critical support level of $175.19. If successful, a fall to $140 is likely.
In the short-term, the first sign of bullishness will be when the LTC/USD pair breaks out of $215. Currently, we don’t find any trade set up on it.
XEM/USD
On Jan. 20 and Jan. 21, the bulls could not sustain above the downtrend line. As a result, NEM has resumed its decline.
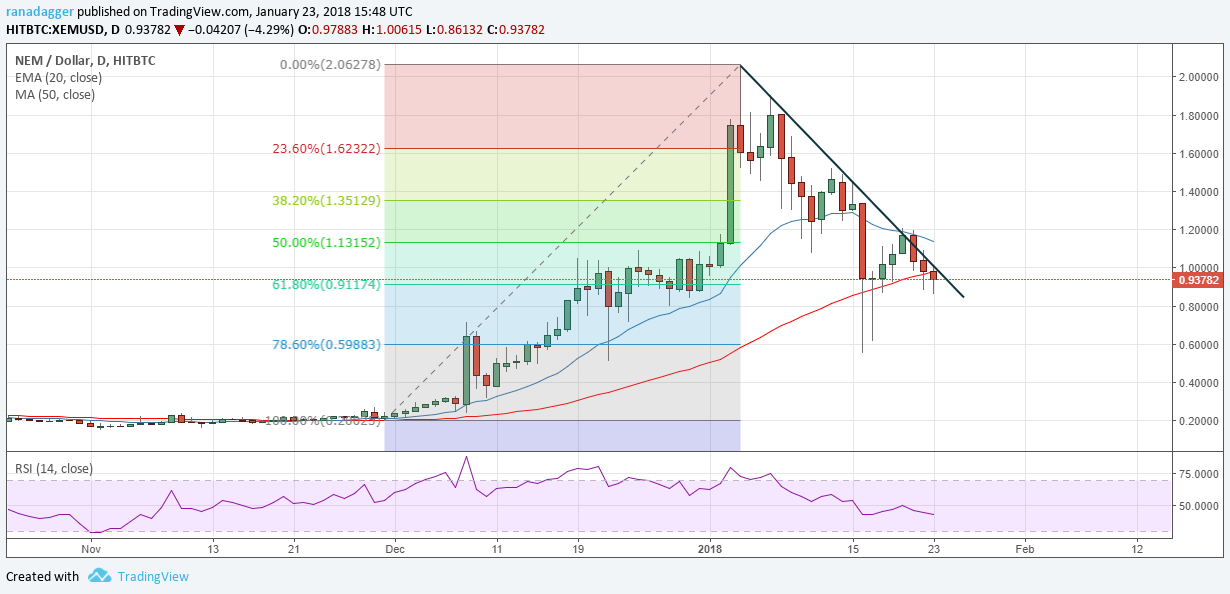
Currently, the bulls are attempting to hold the $0.86 level. If this breaks, a fall to the Jan. 16 lows of $0.551 is likely.
On the upside, the down trendline is likely to offer strong resistance. The first signs of bullishness will be when price breaks out of the $1.21 levels.
We don’t find any trade setups on the XEM/USD pair.
ADA/BTC
Cardano could not break out of the 0.00006 levels. It is now likely to gradually fall to the support levels of 0.000047, and after that to 0.00004070.
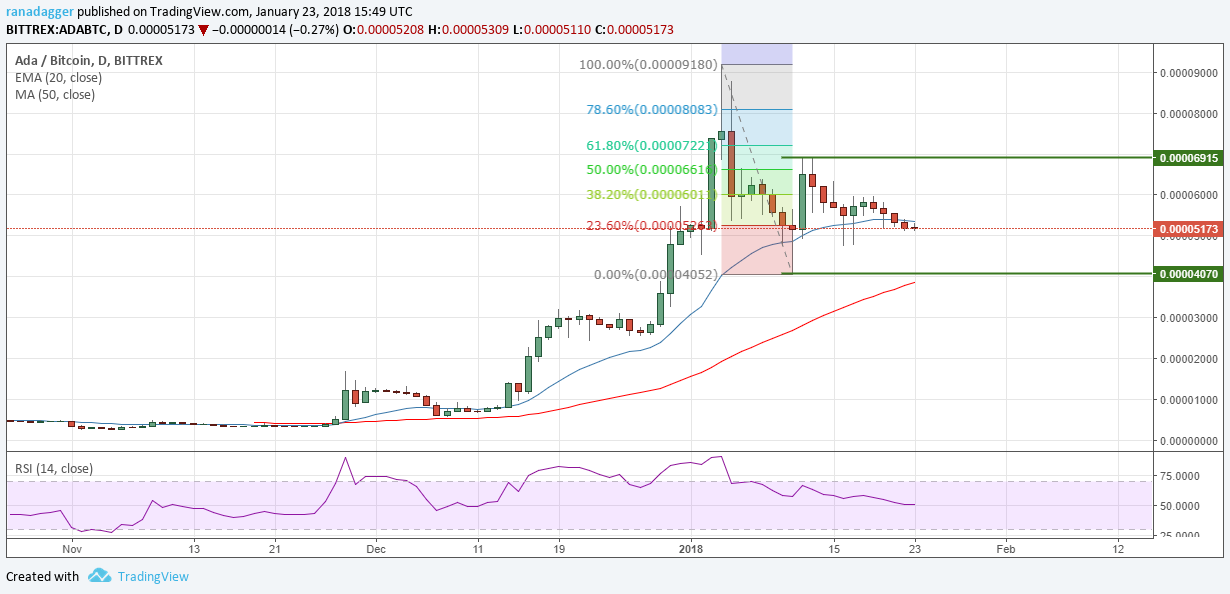
For the next few days, we expect the ADA/BTC pair to remain range bound between 0.00004070 on the downside and 0.00006915 on the upside.
We shall wait for the pair to bounce from one of the support levels before initiating any trade. At the present levels, we don’t find any bullish setups on it.
Author: Rakesh Upadhyay
Posted By David Ogden Entrepreneur

David O